


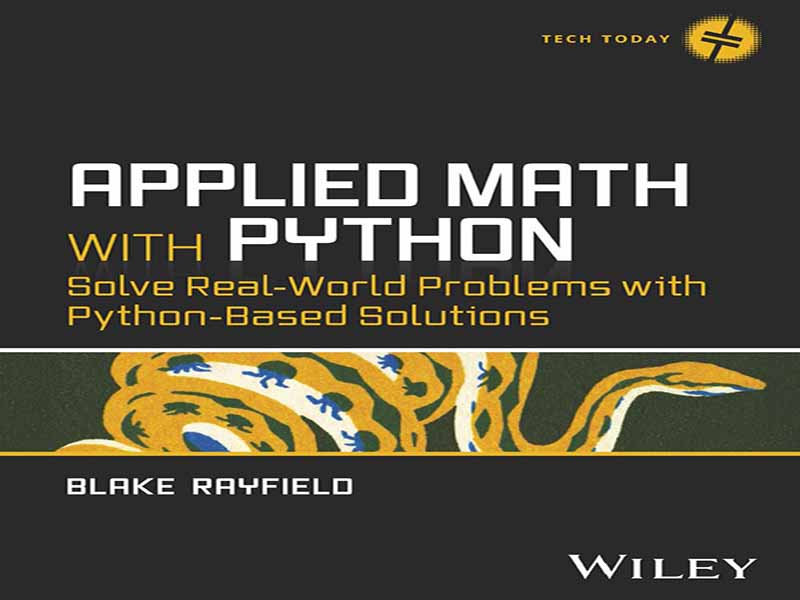
- عنوان کتاب: Applied Math with Python Solve Real-World Problems with Python-Based Solutions
- نویسنده: Blake Rayfield
- حوزه: برنامهنویسی پایتون
- سال انتشار: 2026
- تعداد صفحه: 286
- زبان اصلی: انگلیسی
- نوع فایل: pdf
- حجم فایل: 5.72 مگابایت
این کتاب برای پر کردن شکاف بین تئوری ریاضی انتزاعی و نتایج تجاری عملی با استفاده از پایتون طراحی شده است. با ترکیب کد عملی با نمودارهای مبتنی بر داده، میتوانید از برنامهنویسی ساده فراتر بروید تا به شما نشان دهد چگونه از ریاضیات برای حل چالشهای تجاری استفاده کنید. بخشهای زیر نقشهای از سفر ما را ارائه میدهند که با یک راهاندازی ساده شروع میشود و با تکنیکهای تجسم پیشرفته که تصمیمگیری را هدایت میکنند، پایان مییابد. قسمت 1: شروع به کار قسمت 1 به زمین می خورد که برای بالا بردن سرعت شما طراحی شده است. این یک راهاندازی ساده از کیت ابزار ضروری پایتون و یک تازهسازی مختصر در مورد عملیات اصلی مورد نیاز برای تجزیه و تحلیل فوری دادههای کسبوکار را فراهم میکند. برخی از ترفندهای برنامه نویسی عمومی و همچنین کتابخانه ها و تجسم های اولیه را که بینش های اولیه کسب و کار را هدایت می کنند، یاد می گیرید.
This book is designed to bridge the gap between abstract mathematical theory and practical business results using Python. By combining hands-on code with data-driven charts, you can move beyond simple programming to show you how to use math to solve business challenges. The following sections provide a roadmap of our journey, beginning with a streamlined setup and ending with advanced visualization techniques that drive decision-making. Part 1: Getting Started Part 1 hits the ground running, designed to get you up to speed. It provides a streamlined setup of the essential Python toolkit and a concise refresher on the core operations needed to analyze business data immediately. You learn some general programming tricks as well as the libraries and initial visualizations that drive early business insights. In Chapter 1, “Introduction to Python for Business Applications,” you are introduced to the core Python commands and why the language is essential for modern business analytics and automation. Chapter 2, “Basic Mathematical Operations in Python,” builds on this by reviewing essential math routines, variables, and data types using powerful libraries like NumPy and Pandas. Chapter 3, “Visualization for Business Decision-making,” explores how to apply these foundations to present data in a relatable way that drives organizational decisions. Part 2: Applying the Math In Part 2, the focus is on the specific mathematical concepts that solve real-world problems. It bridges the gap between theory and application, teaching you how to use Python to optimize operations, model financial risks, and forecast performance. By understanding the underlying math, you will be better equipped to apply calculus, linear algebra, and statistics to achieve concrete business goals. Chapter 4, “Linear Algebra for Business and Finance,” uses vectors and matrices to create a practical language for organizing information and modeling complex financial risks. Chapter 5, “Calculus for Business Problem Solving,” provides a toolkit for understanding operational momentum, such as identifying the exact point of diminishing returns in a marketing campaign. Chapter 6, “Optimization Techniques for Business Strategy,” and Chapter 7, “Probability and Statistics for Business Analytics,” introduce the necessary tools to maximize operational efficiency and manage the uncertainties inherent in business forecasting. This part concludes with Chapter 8, “Applied Business Problems with Math and Python,” which synthesizes these tools through real-world case studies in logistics, finance, and operations management. Part 3: Visualizing the Numbers Data has more value when it drives decisions. Part 3 focuses on translating complex analysis into clear, compelling visuals that stakeholders can act on. It moves beyond basic charting to specific business use cases, tracking financial trends over time, comparing cross-sectional market performance, and handling alternative data types, ensuring your analysis tells a story that leads to actionable strategy. Chapter 9, “Illustrating Time-series and Linear Data,” focuses on matching the right chart to your data structure and smoothing temporal data to reveal hidden trends. Chapter 10, “Illustrating Cross-sectional Data,” teaches you to analyze rank, distribution, and correlation at a single point in time through visual “snapshots” like histograms and scatterplots. Finally, Chapter 11, “Illustrating Alternative Data Types,” explores how to visualize unstructured sources like text, geographic maps, and complex networks by converting qualitative signals into visualizations.
این کتاب را میتوانید از لینک زیر بصورت رایگان دانلود کنید:
Download: Applied Math with Python Solve Real-World Problems with Python-Based Solutions


نظرات کاربران