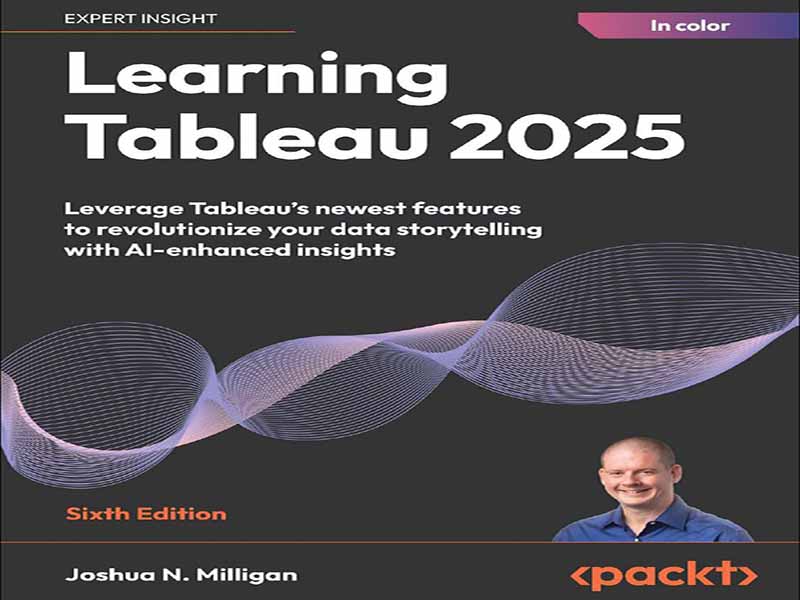
- عنوان: Learning Tableau 2025 -Leverage Tableau’s newest features to revolutionize your data storytelling with AI-enhanced insights
- نویسنده: Pablo Sáenz de Tejada
- حوزه: تحلیل داده, بصری سازی داده
- سال انتشار: 2025
- تعداد صفحه: 590
- زبان اصلی انگلیسی
- نوع فایل: pdf
- حجم فایل: 18.4 مگابایت
وقتی Tableau برای اولین بار معرفی شد، یک تغییر الگوی چشمگیر از گزارشهای جدولی و چرخههای گسترده ادغام دادهها بود که مدتها پس از تصمیمگیریهای مرتبط، نتایج را به دست میدادند. Tableau الگوی تعامل بصری با دادهها را متحول کرد و همچنان الگویی منحصر به فرد ارائه میدهد – الگویی که کار عملی با دادهها، دریافت بازخورد بصری فوری با هر اقدام، و پرسیدن سوال و کشف بینشها را در یک جریان طبیعی فکر و تعامل، آسان و شهودی (و سرگرمکننده!) میکند. نتیجه، یک #datafam رو به رشد است، جامعهای که Tableau را به خاطر سادگی، زیبایی و تواناییاش در سرگرمکننده کردن کار با دادهها دوست دارد! فراتر از الگوی اصلی، Tableau به نوآوری ادامه میدهد – با ترکیب ویژگیها و الگوهای جدید، کار دیدن، درک و عمل بر اساس دادهها را حتی آسانتر و لذتبخشتر از همیشه میکند! Tableau با مدل داده و تجزیه و تحلیل چند واقعیتی، یعنی افزونهها، ادغام هوش مصنوعی (از جمله Tableau Agent و Tableau Pulse)، همچنان مرزهای نحوه تعامل تحلیلگران، کاربران تجاری و تصمیمگیرندگان با دادهها را جابجا میکند. ما به Tableau از دریچهی درک الگوی اساسی چگونگی و چرایی کارکرد Tableau، در چارچوب مثالهای عملی، نگاه خواهیم کرد. سپس بر این پایهی محکم از درک بنا خواهیم نهاد تا شما ابزارها و مهارتهای لازم برای مقابله با حتی سختترین چالشهای داده را داشته باشید! این کتاب برای هر کسی است که نیاز به دیدن و درک دادههای خود دارد! از کاربر تجاری گرفته تا تحلیلگر دادهی حرفهای و مدیرعامل و تصمیمگیرندگان اجرایی، همه باید توانایی پرسیدن و پاسخ دادن به سوالات مربوط به دادهها را داشته باشند. داشتن کمی پیشزمینه با دادهها قطعاً کمک خواهد کرد، اما نیازی نیست که به اسکریپتنویسی، SQL یا ساختارهای پایگاه داده اعتماد داشته باشید. چه در Tableau تازهکار باشید و چه ماهها یا حتی سالها از آن استفاده کرده باشید، با این کتاب، پایهی محکمی از درک Tableau و ابزارها و مهارتهای لازم برای تسلط پیشرفته بر این ابزار را به دست خواهید آورد. فصل 1، «شروع با Tableau»، اصول بنیادی Tableau را معرفی میکند. ما چندین مثال را در یک پیشرفت منطقی بررسی خواهیم کرد که همه چیز را از رابط کاربری گرفته تا اتصال به دادهها، ساخت اولین تجسم شما و حتی یک داشبورد معرفی میکند. این فصل، پایه محکمی برای اصطلاحات و مفاهیمی که در سراسر کتاب استفاده خواهند شد، به شما میدهد. فصل 2، اتصال به دادهها و Tableau، مفاهیم اساسی مربوط به اتصال به دادهها را با استفاده از چندین مثال عملی پوشش میدهد. این فصل انواع مختلف اتصالات، انواع فایلها، پایگاههای داده ابری و محلی و نحوه کار با فرادادهها را پوشش میدهد. فصل 3، فراتر رفتن از مصورسازیهای اولیه، بر اساس اصول مصورسازی اولیه مطرح شده در فصل اول، به بررسی تغییرات و امکانات گسترده میپردازد. شما یاد خواهید گرفت که چه زمانی و چگونه از طیف گستردهای از مصورسازیها برای تجزیه و تحلیل و ارتباط دادهها استفاده کنید. فصل 4، شروع یک ماجراجویی با محاسبات، محاسبات و پارامترها را معرفی میکند، مروری بر انواع اصلی محاسبات و سپس مثالهای مفصلی از محاسبات سطح ردیف و کل ارائه میدهد. این فصل دانش مفهومی را با مثالهای عملی ترکیب میکند و با ملاحظات عملکرد به پایان میرسد. فصل 5، استفاده از محاسبات سطح جزئیات، نگاهی عمیق به عبارات سطح جزئیات و نحوه استفاده از آنها برای حل چالشهای پیچیده داده دارد. این فصل نه تنها یک مرور کلی ارائه میدهد، بلکه به نمونههایی از FIXED، INCLUDE و EXCLUDE نیز میپردازد. فصل 6، با عنوان «بررسی عمیق محاسبات جدول»، پایهای قوی برای درک و استفاده از محاسبات جدول برای حل طیف وسیعی از چالشهای داده به شما میدهد. این فصل مفاهیم دامنه و جهت، آدرسدهی و پارتیشنبندی را پوشش میدهد و چندین مثال عملی عمیق را بررسی میکند. فصل 7، «ساخت مصورسازیهایی که عالی به نظر میرسند و به خوبی کار میکنند»، نحوه گسترش و تغییر قالببندی پیشفرض اعمال شده بر مصورسازیها توسط Tableau را پوشش میدهد تا گزینههایی مانند فونت، رنگ، خطوط، سایهزنی، حاشیهنویسیها و راهنماها را برای انتقال مؤثر یک داستان داده سفارشی کند. فصل 8، «بیان یک داستان داده با داشبوردها»، بر اساس مفاهیمی بنا شده است که در فصل اول معرفی و در سراسر فصل گسترش یافتهاند. این فصل چندین مثال عملی از انواع مختلف داشبورد را بررسی میکند تا به شما در درک عمیقی از چیستی داشبورد، نحوه ساخت آن و تعاملی کردن آن و نحوه استفاده از آن برای بیان یک داستان داده جذاب کمک کند. فصل 9، تحلیل بصری: روندها، خوشهبندی، توزیعها و پیشبینی، قابلیتهای تحلیل آماری بصری موجود در Tableau را معرفی میکند و مثالهای عملی از نحوه و زمان استفاده از این قابلیتها را در اختیار شما قرار میدهد. این شامل اضافه کردن و اصلاح مدلهای روند، استفاده از قابلیتهای خوشهبندی، استفاده و اصلاح مدلهای پیشبینی و تجسم توزیع دادهها میشود. این فصل همچنین شامل جزئیات جدیدی در مورد ویژگیها و رابط کاربری جدید ارائه شده برای Explain Data است. شما نه تنها خواهید فهمید که …
When Tableau was first introduced, it was a dramatic paradigm shift away from tabular reports and extensive cycles of data integration that produced results long after relevant decisions could have been made. Tableau disrupted the paradigm for visually interacting with data, and it continues to offer a unique paradigm – one which makes it easy and intuitive (and fun!) to be hands-on with data, to receive instant visual feedback with every action, and to ask questions and uncover insights in a natural flow of thought and interaction. The result is an ever growing #datafam, a community that loves Tableau for its simplicity, beauty, and ability to make working with data fun! Beyond the core paradigm, Tableau continues to innovate – incorporating new features and new paradigms to make the task of seeing, understanding, and acting upon data even easier and more enjoyable than ever! With data model and multi-fact analysis, viz extensions, AI integration (including Tableau Agent and Tableau Pulse), Tableau continues to push the boundaries of how analysts, business users, and decision makers interact with data. We’ll look at Tableau through the lens of understanding the underlying paradigm of how and why Tableau works, in the context of practical examples. Then we’ll build on this solid foundation of understanding so that you will have the tools and skills to tackle even the toughest data challenges! This book is for anyone who needs to see and understand their data! From the business user to the hardcore data analyst to the CEO and executive decision makers, everyone needs to have the ability to ask and answer questions of data. Having a bit of background with data will definitely help, but you don’t need to be confident with scripting, SQL, or database structures. Whether you’re new to Tableau, or have been using it for months or even years, with this book you’ll gain a solid foundation of understanding Tableau, and the tools and skills to build toward advanced mastery of the tool. Chapter 1, Taking Off with Tableau, introduces the foundational principles of Tableau. We’ll walk through multiple examples in a logical progression that will introduce everything from the interface to connecting to data, building your first visualization, and even a dashboard. This chapter will give you a solid foundation for terminology and concepts that will be used throughout the book. Chapter 2, Connecting to Data and Tableau, covers the foundational concepts involved in connecting to data, using several practical examples. It covers the various types of connections, file types, cloudbased and on-premises databases, and how to work with metadata. Chapter 3, Moving Beyond Basic Visualizations, builds on the basic visualization principles covered in the first chapter to explore variations and extended possibilities. You will learn when and how to use a wide variety of visualizations to analyze and communicate data. Chapter 4, Starting an Adventure with Calculations, introduces calculations and parameters, giving an overview of the major types of calculation and then detailed examples of row-level and aggregate calculations. It combines conceptual knowledge with practical examples, and concludes with performance considerations. Chapter 5, Leveraging Level of Detail Calculations, takes an in-depth look at level of detail expressions and how to use them to solve complex data challenges. It not only gives an overview, but dives into examples of FIXED, INCLUDE, and EXCLUDE. Chapter 6, Diving Deep with Table Calculations, gives you a strong foundation for understanding and using table calculations to solve a wide range of data challenges. It covers the concepts of scope and direction, addressing and partitioning, and walks through several in-depth practical examples. Chapter 7, Making Visualizations That Look Great and Work Well, covers how to extend and alter the default formatting applied to visualizations by Tableau, to customize options such as font, color, lines, shading, annotations, and tooltips to effectively communicate a data story. Chapter 8, Telling a Data Story with Dashboards, builds on concepts that were introduced in the first chapter and expanded on throughout. It walks through several practical examples of various kinds of dashboards to help you gain a solid understanding of what a dashboard is, how to build one and make it interactive, and how to use it to tell a compelling data story. Chapter 9, Visual Analytics: Trends, Clustering, Distributions, and Forecasting, introduces the visual statistical analytics capabilities built into Tableau and supplies you with practical examples of how and when to leverage these capabilities. This includes adding and modifying trend models, leveraging clustering capabilities, using and modifying forecast models, and visualizing the distribution of data. This chapter also includes new details regarding the new features and interface present for Explain Data. You will not only understand how to employ statistical models but also evaluate their accuracy. Chapter 10, Advanced Visualizations, builds upon the visualizations and techniques already covered, demonstrating how Tableau can be used to create any kind of visualization. A multitude of examples demonstrates a wide variety of advanced visualizations, from bump charts to Marimekko charts to animated visualizations. Chapter 11, Dynamic Dashboards, builds your dashboard skills by demonstrating various techniques to show and hide content on a dashboard. The result is a truly dynamic user experience that enhances your ability to communicate data. Chapter 12, Exploring Mapping and Advanced Geospatial Features, demonstrates everything about maps and geospatial visualization, from map basics to geospatial functions, custom territories, and plotting data on custom background images. Chapter 13, Understanding the Tableau Data Model, Joins, and Blends, explores the major ways of relating data in Tableau, including joins, blends, and relationships using Tableau’s data model. With practical examples and detailed descriptions, you will understand the difference between logical and physical layers and how to leverage relationships, joins, and blends to achieve great analytical results. Chapter 14, Structuring Messy Data to Work Well in Tableau, acknowledges that real-world data is sometimes a mess, and gives you a foundation for understanding well-structured data and a toolset for dealing with data that isn’t structured well in Tableau. Chapter 15, Taming Data with Tableau Prep, explores the Tableau Prep Builder tool, including the overall paradigm and specific features. You will work through an extended practical example to understand how to leverage Tableau Prep’s amazing ability to clean and structure data. Chapter 16, Extending Tableau: Extensions and Scripts, explores the incredible potential of extending Tableau’s functionality using new features and integrations in Tableau. The chapter explores dashboard extensions that give you the ability to seamlessly integrate code, backend systems, and new user interfaces directly into your dashboards. You’ll also see examples of leveraging scripts that could be used for anything from data cleansing to advanced predictive models. Chapter 17, AI Assisted Analysis: Tableau Agent and Tableau Pulse, concludes the book with a look at at how to leverage AI in Tableau to assist in everything from analysis to decision making. This chapter covers Tableau Agent, a fully integrated AI assistant that helps with everything from generating calculations and visualizations to answering analytics questions. Additionally, the chapter dives into details on Tableau Pulse which integrates generative AI, predictive modeling, and automation, to give you quick and actionable insights into your most important metrics.
این کتاب را میتوانید بصورت رایگان از لینک زیر دانلود نمایید.
Download: Learning Tableau 2025


نظرات کاربران