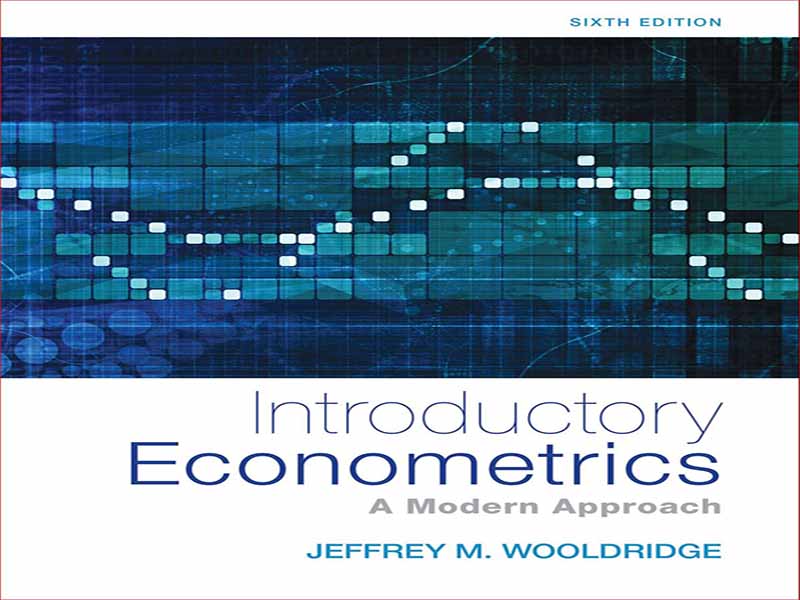
- عنوان کتاب: Introductory Econometrics, 6e
- نویسنده: Jeffrey M. Wooldridge
- حوزه: اقتصاد سنجی
- سال انتشار: 2016
- تعداد صفحه: 818
- زبان اصلی: انگلیسی
- نوع فایل: pdf
- حجم فایل: 12 مگابایت
The sixth edition preserves the overall organization of the fifth. The most noticeable feature that distinguishes this text from most others is the separation of topics by the kind of data being analyzed. This is a clear departure from the traditional approach, which presents a linear model, lists all assumptions that may be needed at some future point in the analysis, and then proves or asserts results without clearly connecting them to the assumptions. My approach is first to treat, in Part 1, multiple regression analysis with cross-sectional data, under the assumption of random sampling. This setting is natural to students because they are familiar with random sampling from a population in their introductory statistics courses. Importantly, it allows us to distinguish assumptions made about the underlying population regression model—assumptions that can be given economic or behavioral content— from assumptions about how the data were sampled. Discussions about the consequences of nonrandom sampling can be treated in an intuitive fashion after the students have a good grasp of the multiple regression model estimated using random samples. An important feature of a modern approach is that the explanatory variables—along with the dependent variable—are treated as outcomes of random variables. For the social sciences, allowing random explanatory variables is much more realistic than the traditional assumption of nonrandom explanatory variables. As a nontrivial benefit, the population model/random sampling approach reduces the number of assumptions that students must absorb and understand. Ironically, the classical approach to regression analysis, which treats the explanatory variables as fixed in repeated samples and is still pervasive in introductory texts, literally applies to data collected in an experimental setting. In addition, the contortions required to state and explain assumptions can be confusing to students. My focus on the population model emphasizes that the fundamental assumptions underlying regression analysis, such as the zero mean assumption on the unobservable error term, are properly stated conditional on the explanatory variables. This leads to a clear understanding of the kinds of problems, such as heteroskedasticity (nonconstant variance), that can invalidate standard inference procedures. By focusing on the population, I am also able to dispel several misconceptions that arise in econometrics texts at all levels. For example, I explain why the usual R-squared is still valid as a goodness-of-fit measure in the presence of heteroskedasticity (Chapter 8) or serially correlated errors (Chapter 12); I provide a simple demonstration that tests for functional form should not be viewed as general tests of omitted variables (Chapter 9); and I explain why one should always include in a regression model extra control variables that are uncorrelated with the explanatory variable of interest, which is often a key policy variable (Chapter 6). Because the assumptions for cross-sectional analysis are relatively straightforward yet realistic, students can get involved early with serious cross-sectional applications without having to worry about the thorny issues of trends, seasonality, serial correlation, high persistence, and spurious regression that are ubiquitous in time series regression models. Initially, I figured that my treatment of regression with cross-sectional data followed by regression with time series data would find favor with instructors whose own research interests are in applied microeconomics, and that appears to be the case. It has been gratifying that adopters of the text with an applied time series bent have been equally enthusiastic about the structure of the text. By postponing the econometric analysis of time series data, I am able to put proper focus on the potential pitfalls in analyzing time series data that do not arise with cross-sectional data. In effect, time series econometrics finally gets the serious treatment it deserves in an introductory text.
این کتاب را میتوانید از لینک زیر بصورت رایگان دانلود کنید:
Download: Introductory Econometrics, 6e


نظرات کاربران